Messsage or execution tracing in Servicebus (SB) allows insight into the message exchange between Servicebus and it’s communication partners (Client applications and Service providers) as well as the message processing within a pipeline. Informations about incoming and outgoing messages, the corresponding headers, the course of variable manipulations and other things are written to the diagnostic logs and can be inspected there, when the tracing is active. By default the message and execution tracing are disabled, due to performance reasons and so it should only be enabled in development environments for debugging purposes.
Enablement of message tracing for proxy or business service or execution tracing on the pipeline level, can be done using Fusion Middleware Control (Enterprise Manager).Under a specific SB project, the corresponding services and pipelines can be found. Enabling the tracing can be simply done by checking the options for message tracing respectively execution tracing in the Operations tab.
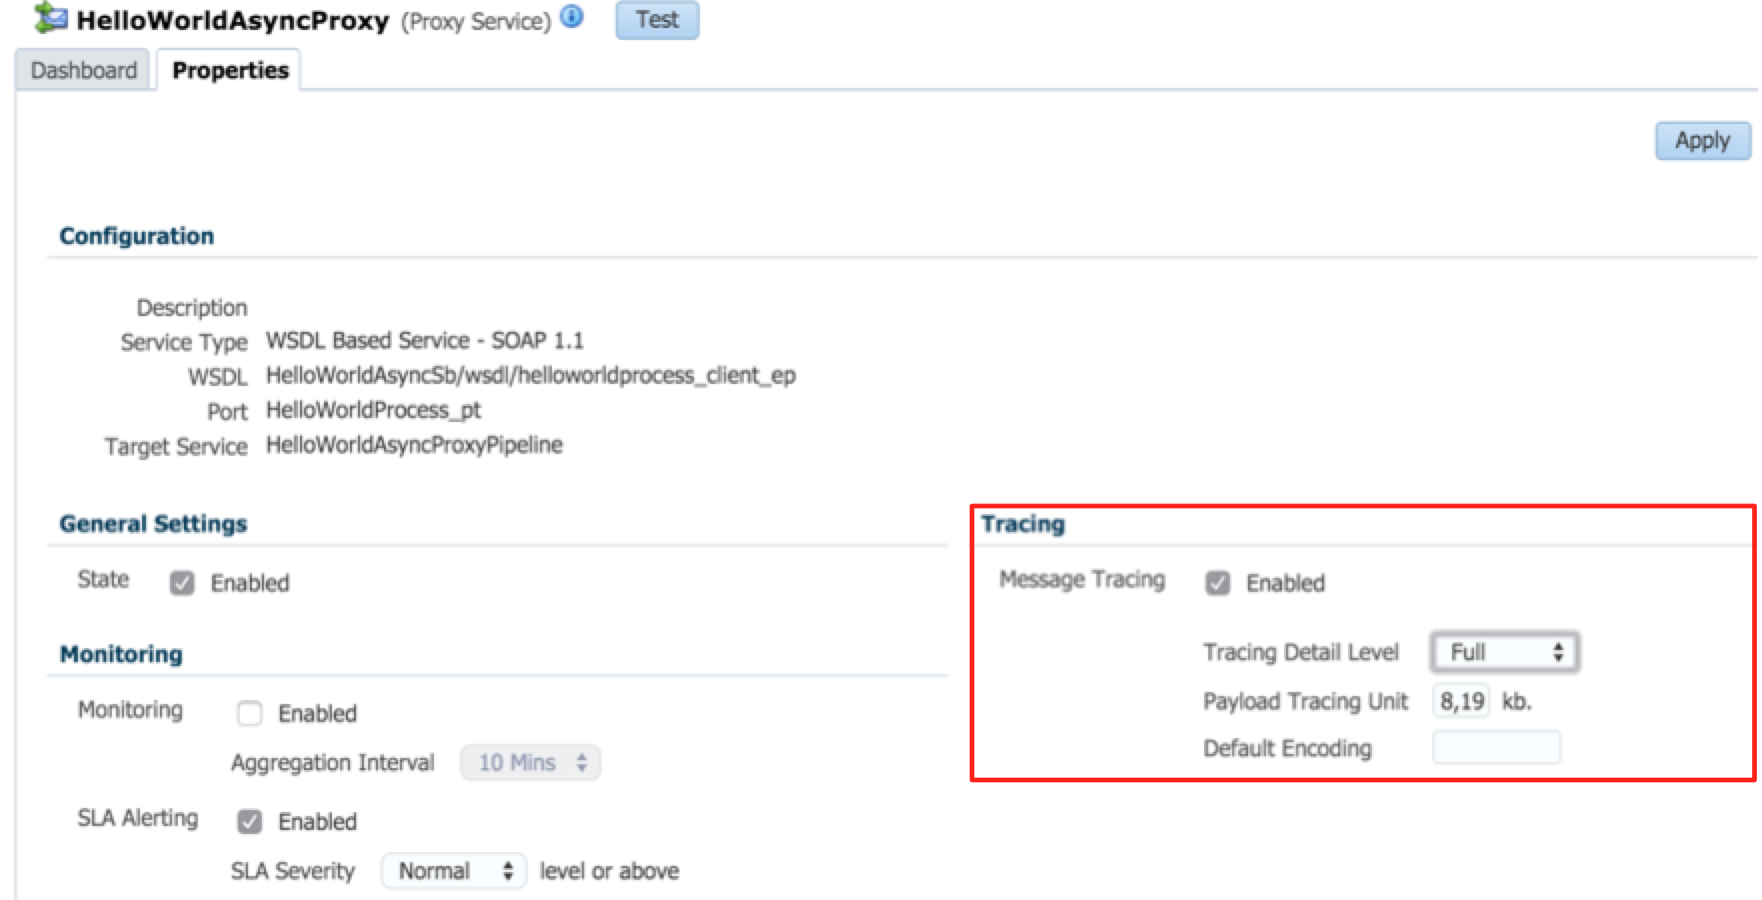
Per default the tracing detail level is set to Terse, which means that the logging information are not that detailed. Change the logging granularity can be done within the details of a specific component (proxy or business service and pipelines). In the example below, the tracing detail level has been set to Full.
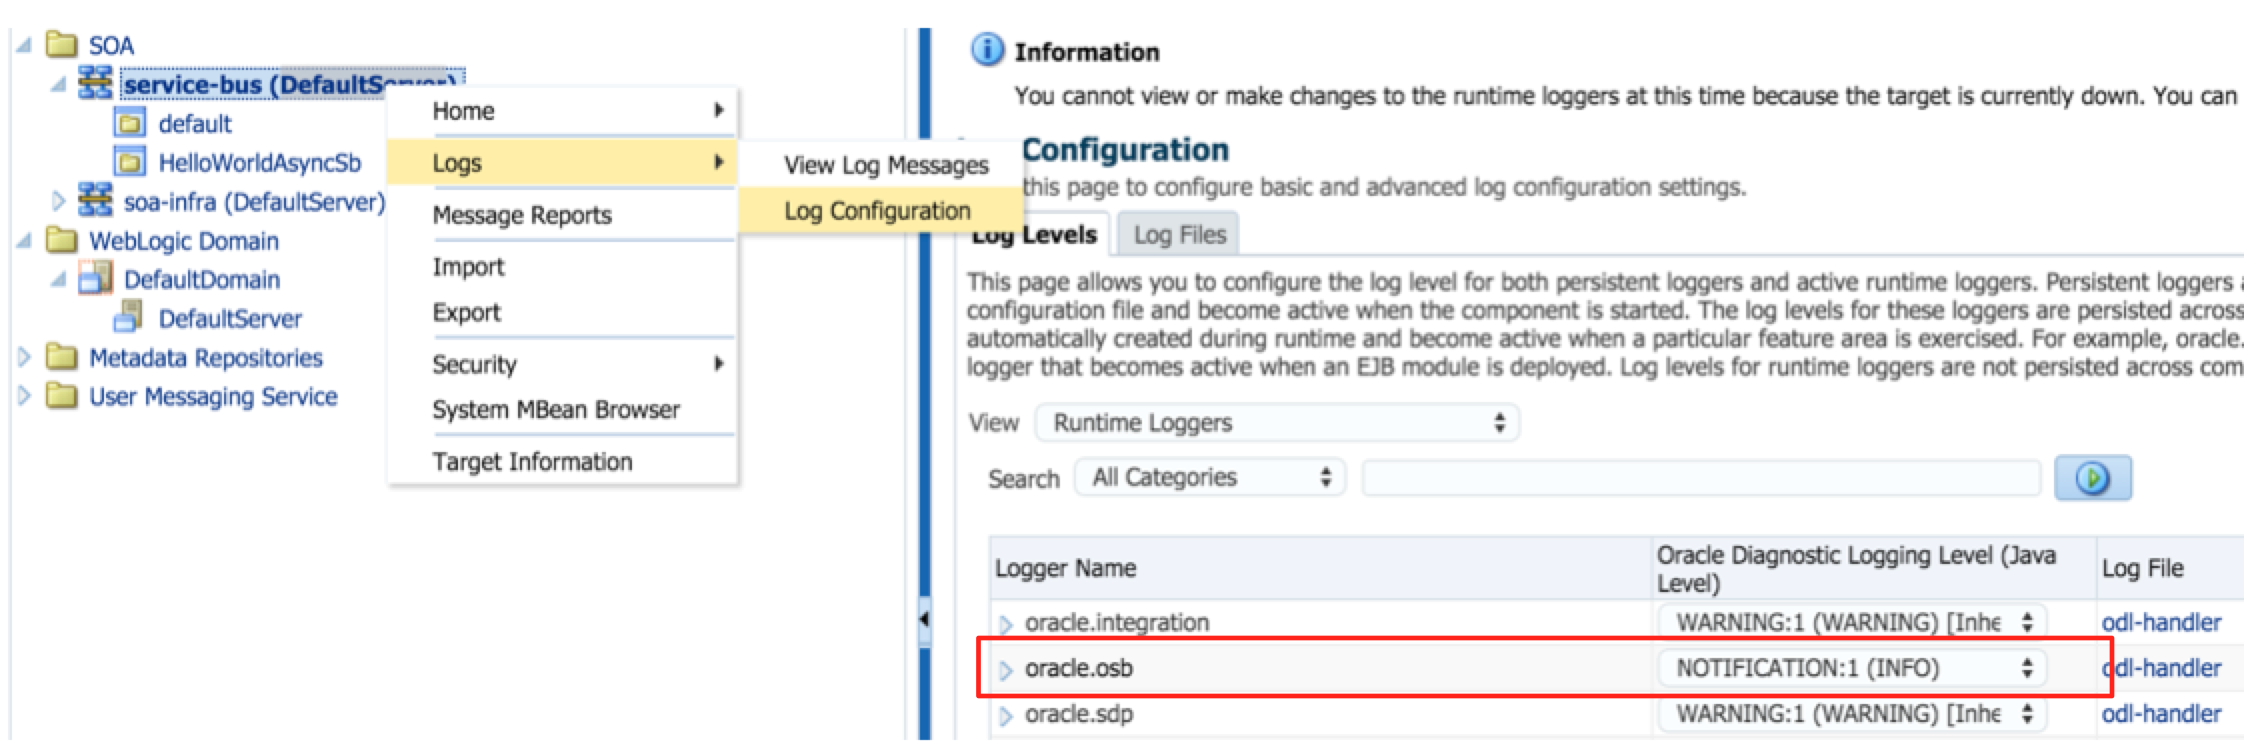
Afterwards it should be checked, if the Log configuration on SB level is set to Notification at least. The default configuration for a DefaultDomain is Warning, which means that no logs are written to the diagnostics logs, even if the configuration on the component level is defined as described before.
The last step is the most important and it took me a while to find out why the tracing information are not written to the diagnostic logs. Please not that the configuration for the log level that has been adjusted in the last step, is not persisted and has to be reconfigured after a server restart!


