
Raw data collected from devices is in most cases not directly relevant for further processing. Data must be analysed and the results are interesting for external systems.
Lets take a vehicle for example. The engine temperature can be monitored and will vary some. We are only interested in the temperature if it is nearing critical values, that is, we can filter the data and only forward data packets to external systems where the temperature reading is higher than the threshold we have set. A more complex example can be monitoring fuel consumption. Here we are not interested in the raw data at all but in the average fuel consumption (l / 100 km) per day. We must aggregate the raw values for a day and only forward the aggregated results to the external system. If we also apply a filter we can also achieve that only days with a high fuel consumption are forwarded and need to be processed further.
The component in the Oracle IoT Cloud Service making the analysis possible is called Stream Explorer. Two different type of objects are of primary interest to us:
- A stream is the continuous flow of the raw data packets coming into the IoT Cloud.
- An exploration is the filtering / grouping / joining of other objects. Source objects can be streams or other explorations and the result is a continuous flow itself
As you can see, analysis results can be chained and each (even intermediary) result can be used for multiple purposes.
You can view the streams you have defined in the Analytics menu on the tab Data in the user interface of the IoT Cloud.
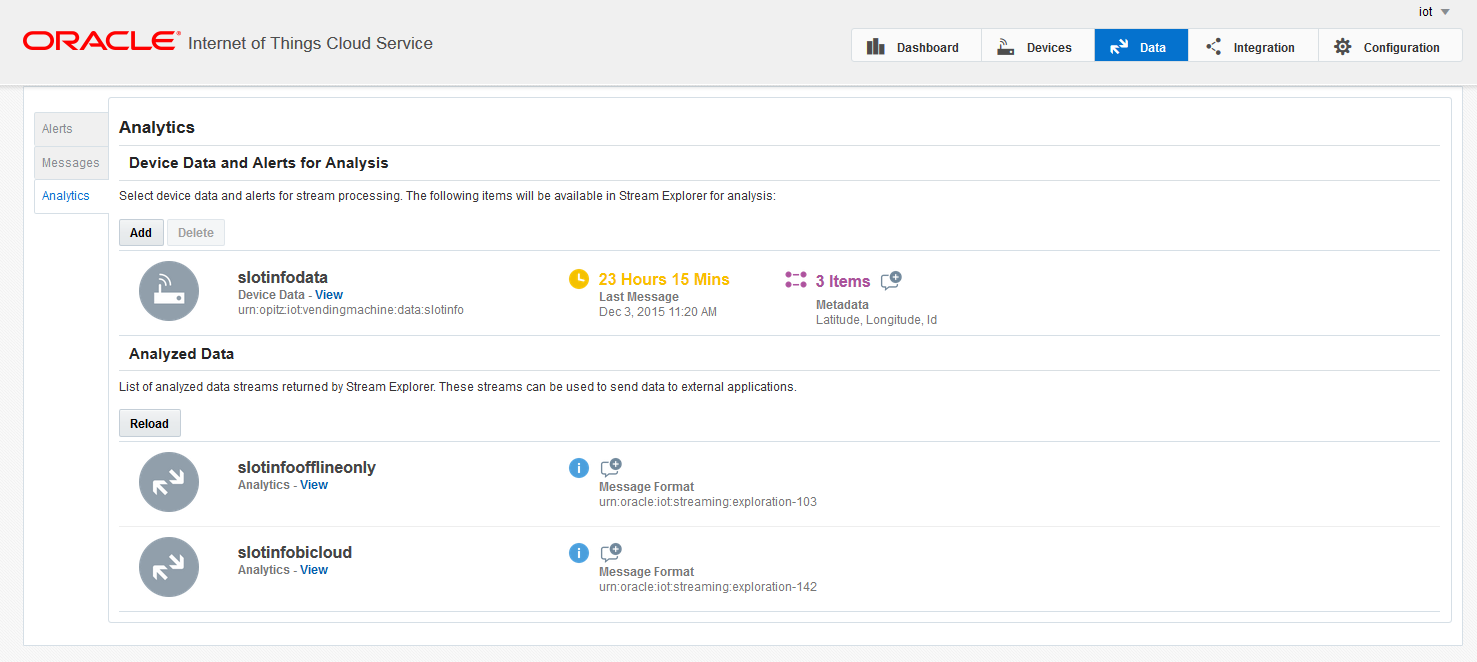
There are two lists here:
- Device Data and Alerts for Analysis shows the streams you have configured.
- Analyzed Data shows the explorations you have created and published (more on publishing an exploration later).
Note that by default the data received by the IoT Cloud is not forwarded to Stream Explorer (no stream is active).
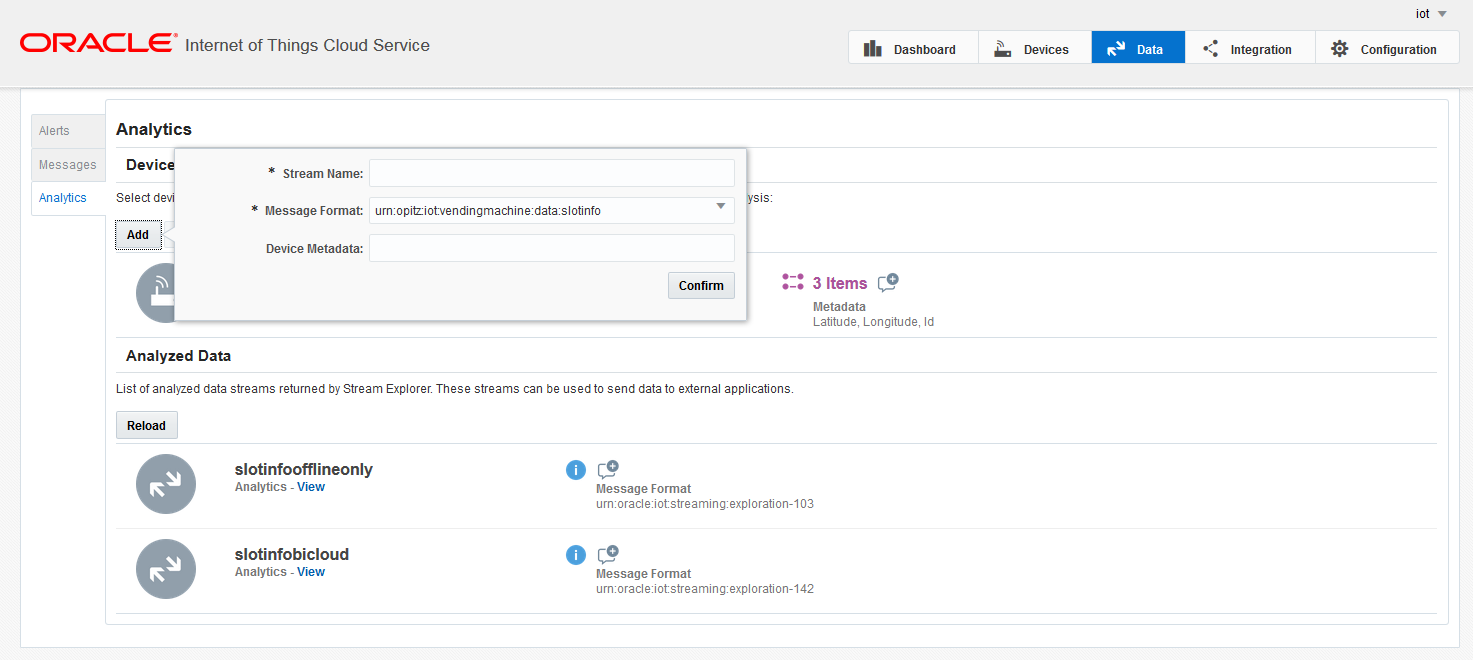
You can easily create the streams which are interesting for analysis using the user interface. A stream is always constructed from messages with a common message format. Please note that metadata information like the location of the device can also be added (either to use for analysis or just to have this information in the result of the exploration).
Once the required streams are set up, the explorations can be configured with Stream Explorer. Stream Explorer is part of the IoT Cloud Service and can also be directly accessed from the IoT Cloud UI by selecting the View button of one of the streams. The exploration configuration screen is shown below.
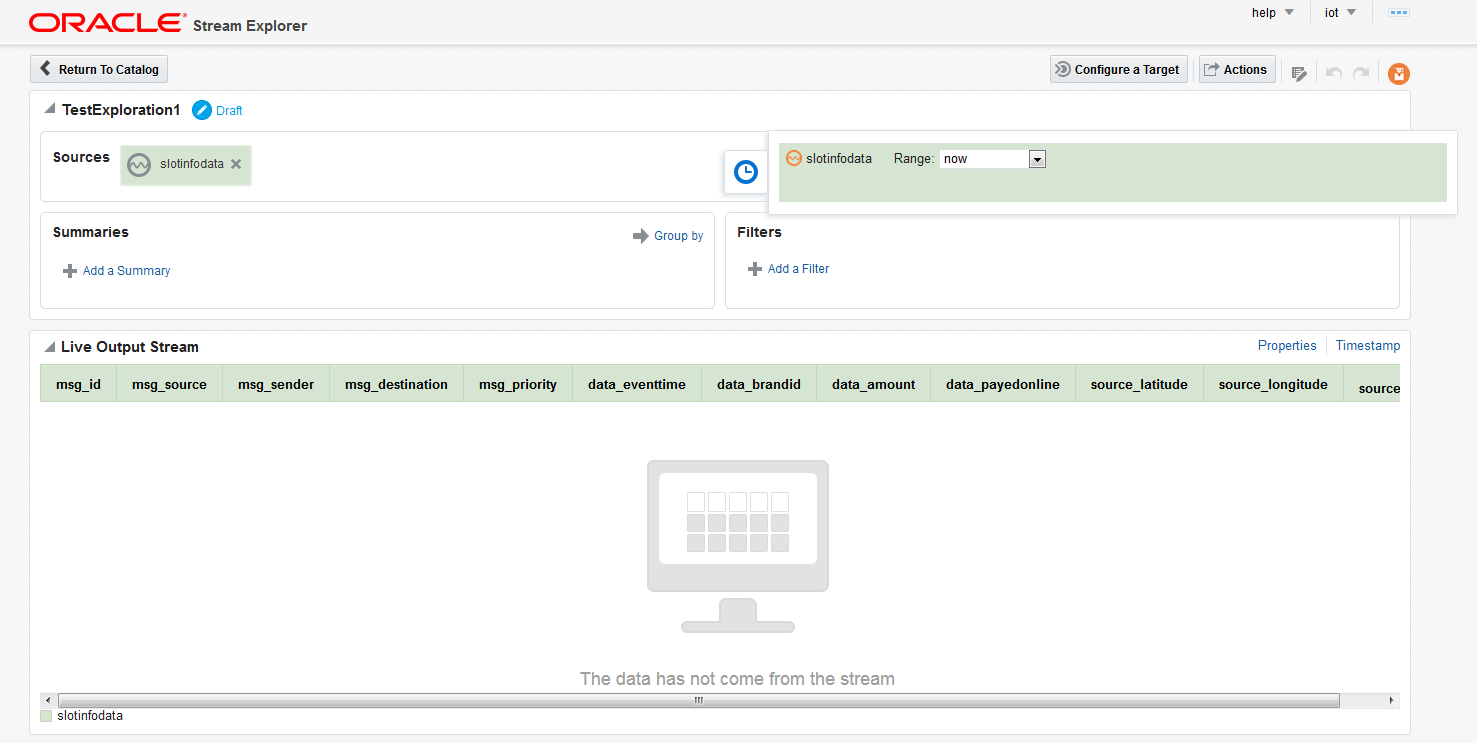
- In the middle of the screen the live output data is shown. At the beginning, this is equal to the input data. If the input stream is active and producing data the result of the configuration can be immediately seen here.
- On the right-hand sing above the table with the live data the properties can be configured. Here columns can be selected/deselected to be included in the output.
- In the upper section on the top the sources can be found. You can add multiple sources here. The source selected while creating the exploration is prefilled.
- In the Filters section filters can be configured. In the example, if you only want to output events where the amount is more than 1000, you can configure that here. Filters can only be applied to the input data but the comparison can be done not only against a fix value but also against another input field (for example temperature greater than threshold if both values are sent by the device). Multiple filters can be joined together either by AND or by OR.
- The Summaries section makes aggregations possible. Here you can select aggregate functions (MAX, MIN, AVG, COUNT, etc.) based on input columns to generate virtual output columns. Filters can also be applied to these newly created columns.
- The aggregate functions only make sense if a time period is set up for aggregation. This can be done with the clock symbol on the right side of the sources. For each source the range can be selected here. The range can be anything from no aggregation (default) to unbounded (maximum possible aggregation).
Having completed the exploration, its result can be inspected with the help of the live data browser. Is the result equal to what you would the exploration can be published (using the Actions menu). Published explorations appear in the IoT Cloud UI and can be set up for transfer to external systems. Editing a published exploration creates a draft version of it, leaving the published version ontouched and running. Only if you are satisfied with the draft version and publish it will the published version change.
In the next part we will show you how to do all these operations from the API of the IoT Cloud Service.
Having the analysis results and the raw data you require these need to be forwarded to external systems which can automatically react to certain situations like a BPM system starting a process where a technician can be sent to fix a faulty device. These aspects will be covered in the part after that.


